

Detecting Bias in Your Training Data
Step-by-step approach to auditing datasets for representation gaps, demographic imbalances, and historical biases before they become model problems.
Read ArticleLearn practical techniques for detecting model degradation and fairness violations in production systems. A guide to maintaining ethical AI performance over time.

Deploying a model isn't the finish line — it's the starting point. Once your model lives in production, you're dealing with real data, real users, and real consequences. The thing is, models don't stay frozen. They drift. User behavior changes. Data distributions shift. And when your fairness metrics start creeping out of acceptable ranges, you need to know about it immediately.
We're going to walk you through how to actually monitor for both drift and fairness issues. Not the theoretical stuff — the practical approaches you can implement with your current tooling. You'll see what to measure, how to measure it, and what to do when something goes wrong.

Model drift happens when the relationship between your input features and target variable changes over time. Your model was trained on data from 2024, but now it's 2026 and user preferences have shifted. Economic conditions changed. Seasonal patterns evolved.
There are three types worth tracking. Data drift is when the distribution of your input features shifts — maybe your app suddenly gets users from a different region. Concept drift is more insidious — the relationship between inputs and outputs changes, but the input distribution looks the same. You're predicting the right thing, but the rules of the world changed. And then there's label drift, which happens when your ground truth itself changes meaning or distribution.
You'll start noticing drift through performance metrics declining, sure. But you can also catch it before it tanks your accuracy by monitoring the actual feature distributions and prediction patterns. It's like watching someone's blood pressure creep up gradually — you intervene before the heart attack.

Fairness isn't something you check once at deployment and forget about. You've got to track it continuously. Here's what matters: demographic parity (are different groups getting approved/rejected at the same rate?), equalized odds (same true positive and false positive rates across groups?), and individual fairness (similar people getting similar outcomes?).
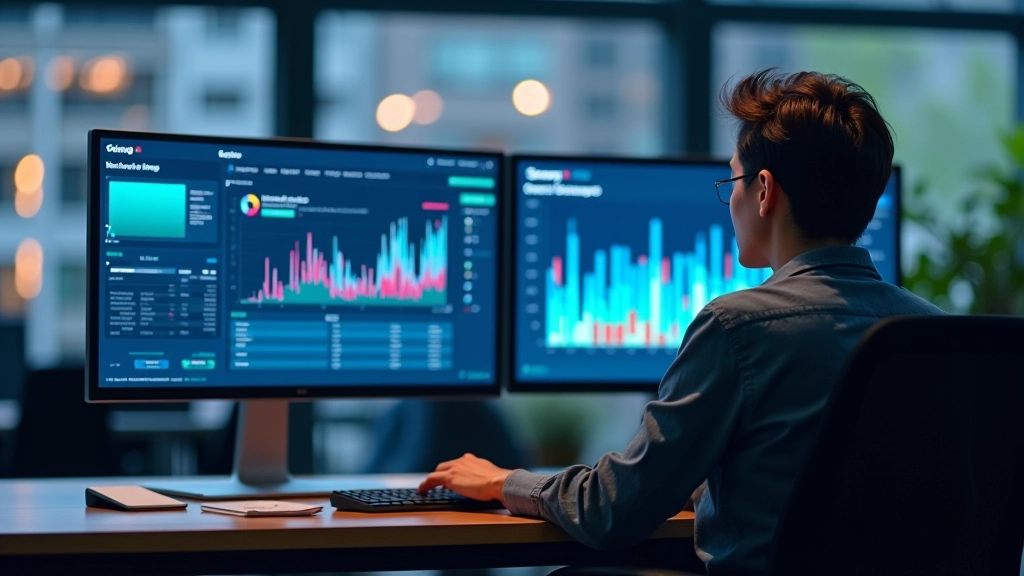
Set up dashboards that show you these metrics broken down by the protected characteristics you care about — age, gender, geography, whatever's relevant to your use case. Don't just track one metric. A model can improve on demographic parity while getting worse on equalized odds. You're looking for a balanced picture.
The tricky part? You need ground truth labels to calculate fairness metrics properly. If you're predicting loan approvals, you need to know which applicants actually repaid their loans. That takes time. So you'll probably be running these calculations with some lag — maybe quarterly or monthly depending on your volume.
This article is educational and informational. It describes general approaches and techniques for monitoring machine learning systems. Specific implementation details, thresholds, and strategies should be adapted to your organization's particular context, regulatory requirements, and business objectives. Consult with your data science and ethics teams when designing monitoring systems for your production models.
You don't need fancy tools to get started. A solid monitoring setup has a few core pieces. First, you're logging predictions and features for every inference. Every single one. Store them somewhere you can query later. Second, you're calculating metrics on a regular schedule — could be daily, could be weekly. Third, you've got alerts set up so someone knows when things go sideways.
For drift detection, start simple. Compare the statistical distribution of your features now versus when you trained the model. Use a Kolmogorov-Smirnov test or Jensen-Shannon divergence — there are libraries for this. If the distance is beyond your threshold, you've got drift. Same approach for your predictions: compare the distribution of prediction scores or predicted classes across time windows.
The key is choosing meaningful thresholds. A 5% shift in feature distribution might be totally normal for your use case. Or it might be catastrophic. You figure this out by looking at historical data and understanding what changes have actually mattered for your model's performance. Don't just pick arbitrary numbers.

Continue exploring ethical AI frameworks and bias mitigation
Step-by-step approach to auditing datasets for representation gaps, demographic imbalances, and historical biases before they become model problems.
Read Article
How to design recommendation algorithms that don't just maximize engagement but actively promote diversity and fair representation across user segments.
Read Article
How to frame responsible AI practices in ways that resonate with product teams, executives, and business stakeholders. Building organizational support for ethics initiatives.
Read ArticleThe teams that do this well don't overthink it. They start with basic monitoring — feature distributions, prediction distributions, fairness metrics broken down by demographic groups. They set thresholds based on what they've learned from their data. And they build alerts so someone notices when things drift.
You'll iterate. Your thresholds will be wrong at first. You'll find out that some metrics matter more than others for your specific use case. You'll discover that certain types of drift are harmless but others tank your performance. That's the learning process, and it's normal.
The critical piece is not letting your model run blind in production. Set up monitoring early, even if it's imperfect. Get data flowing. Start seeing patterns. You're not looking for perfection — you're looking for visibility. Once you can see what's happening, you can respond.